
Ch.12: Bias-Variance Tradeoff
Inspired by: YouTube
In the previous post on Polynomial Regression, a degree 1 line underfit the data, a degree 2 curve fit it well, and a very high degree curve went wild. Bias and variance are the two ideas that explain exactly what went wrong (or right) in each of those three cases.
Three Models, Same Data
Take the same small dataset and fit three models of increasing complexity to it: is a straight line, is a smooth curve, is a wiggly high-degree curve. Circles are the training points the model was fit on; crosses are test points it never saw.
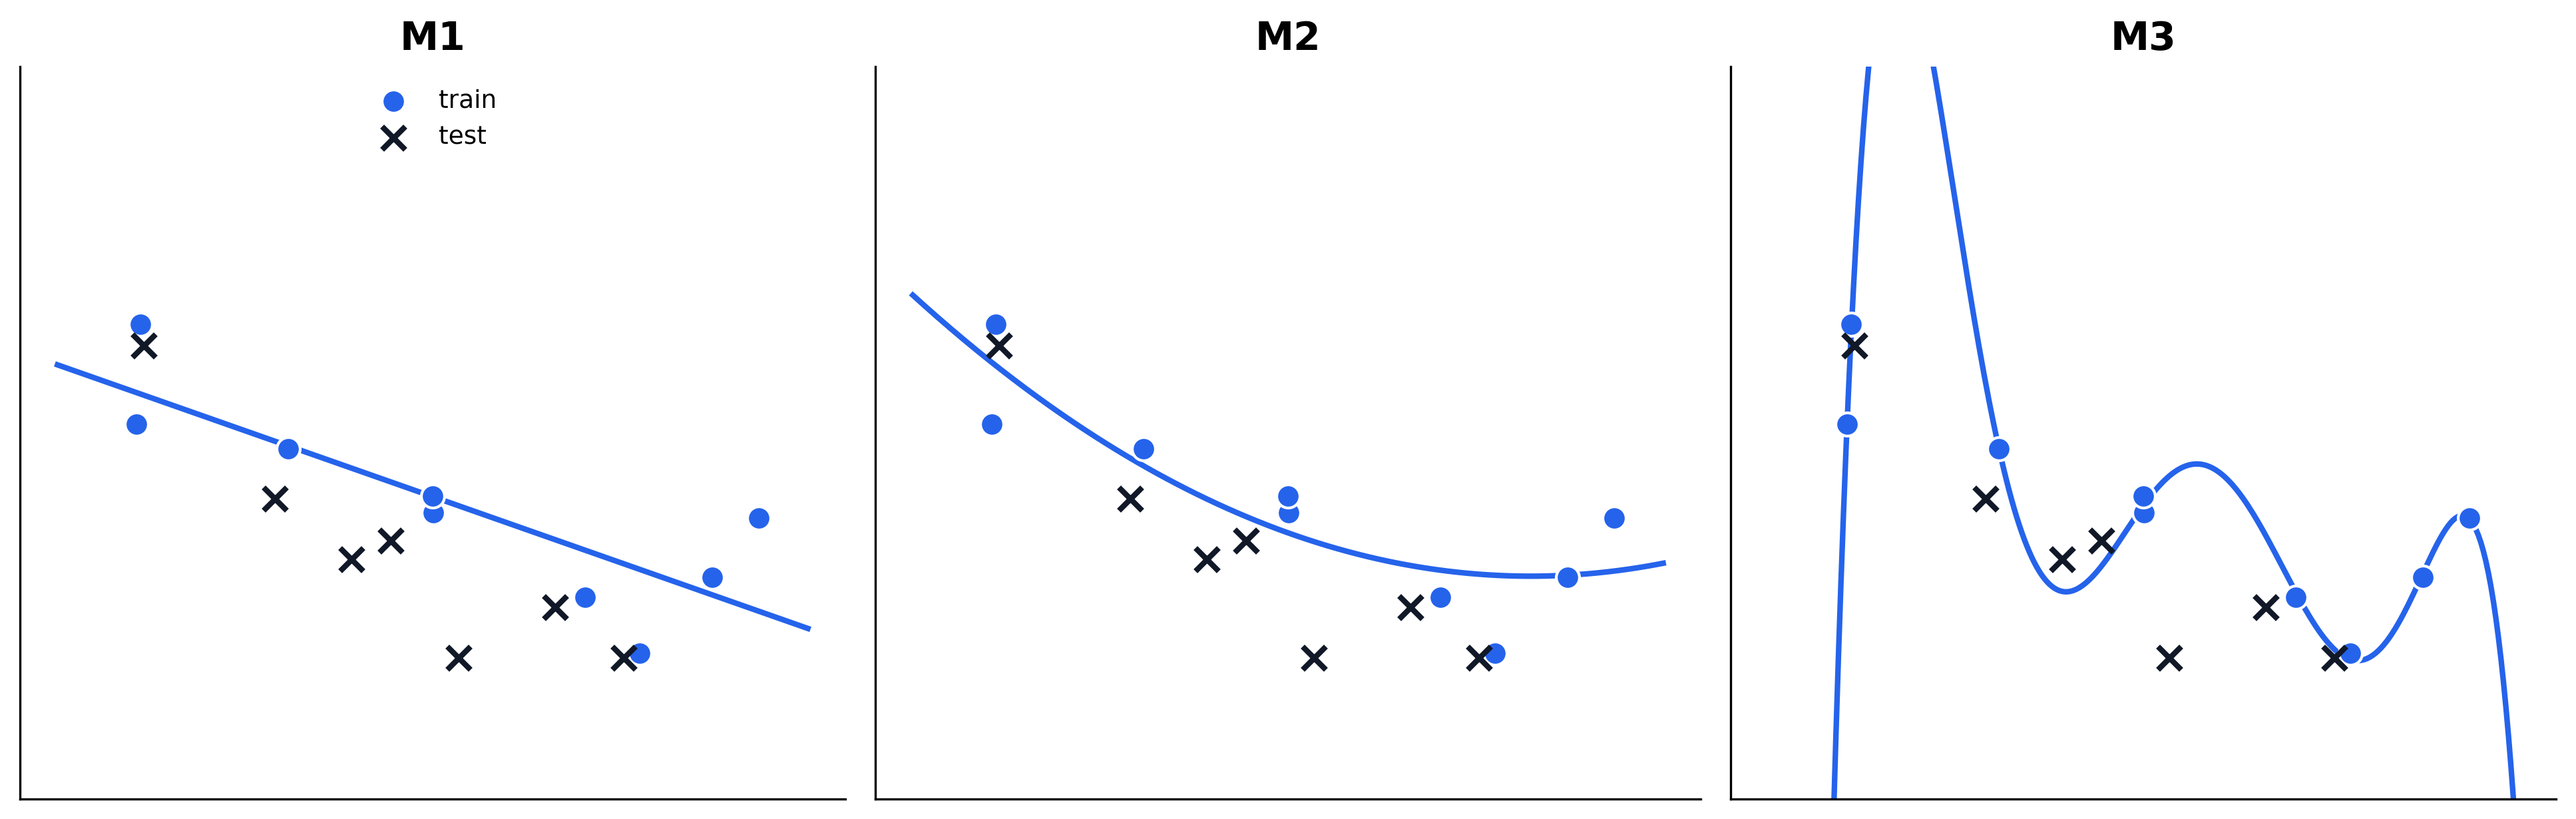
- : a straight line. It cuts through the data but never bends to follow the actual curve, missing both train and test points.
- : a smooth curve that follows the true shape of the data, passing close to both the train and the test points.
- : a wiggly curve that threads through every single training point exactly, but swings wildly everywhere else, including right past the test points.
What Is Bias?
Bias is how far off a model's own assumptions are from the true relationship in the data, that is, how well it can fit the pattern it was trained on in the first place.
has high bias: a straight line is structurally too rigid to bend into the curve the data actually follows, so it fits the training points poorly. and both have low bias: they are flexible enough to curve through the training points closely, even more so since it passes through nearly every one of them exactly.
Bias, on its own, only tells you how well a model fits the data it has already seen. It says nothing yet about new data.
A common mix-up: "bias" here does not mean the model is leaning toward or favoring the training data, that's actually the opposite failure mode, described below as variance. Statistical bias means a systematic, built-in error that doesn't go away no matter how much training data you provide. 's straight line is too rigid to bend into a curve regardless of how many points it sees, the error is baked into the model's assumption, not into which specific data it happened to train on.
What Is Variance?
Variance is how much a model's performance changes between the data it was trained on and new, unseen data.
To see this concretely, fit a KNN classifier of increasing complexity (fewer neighbors = more complex, more prone to chasing individual points) and compare its accuracy on the training set versus a held-out test set:
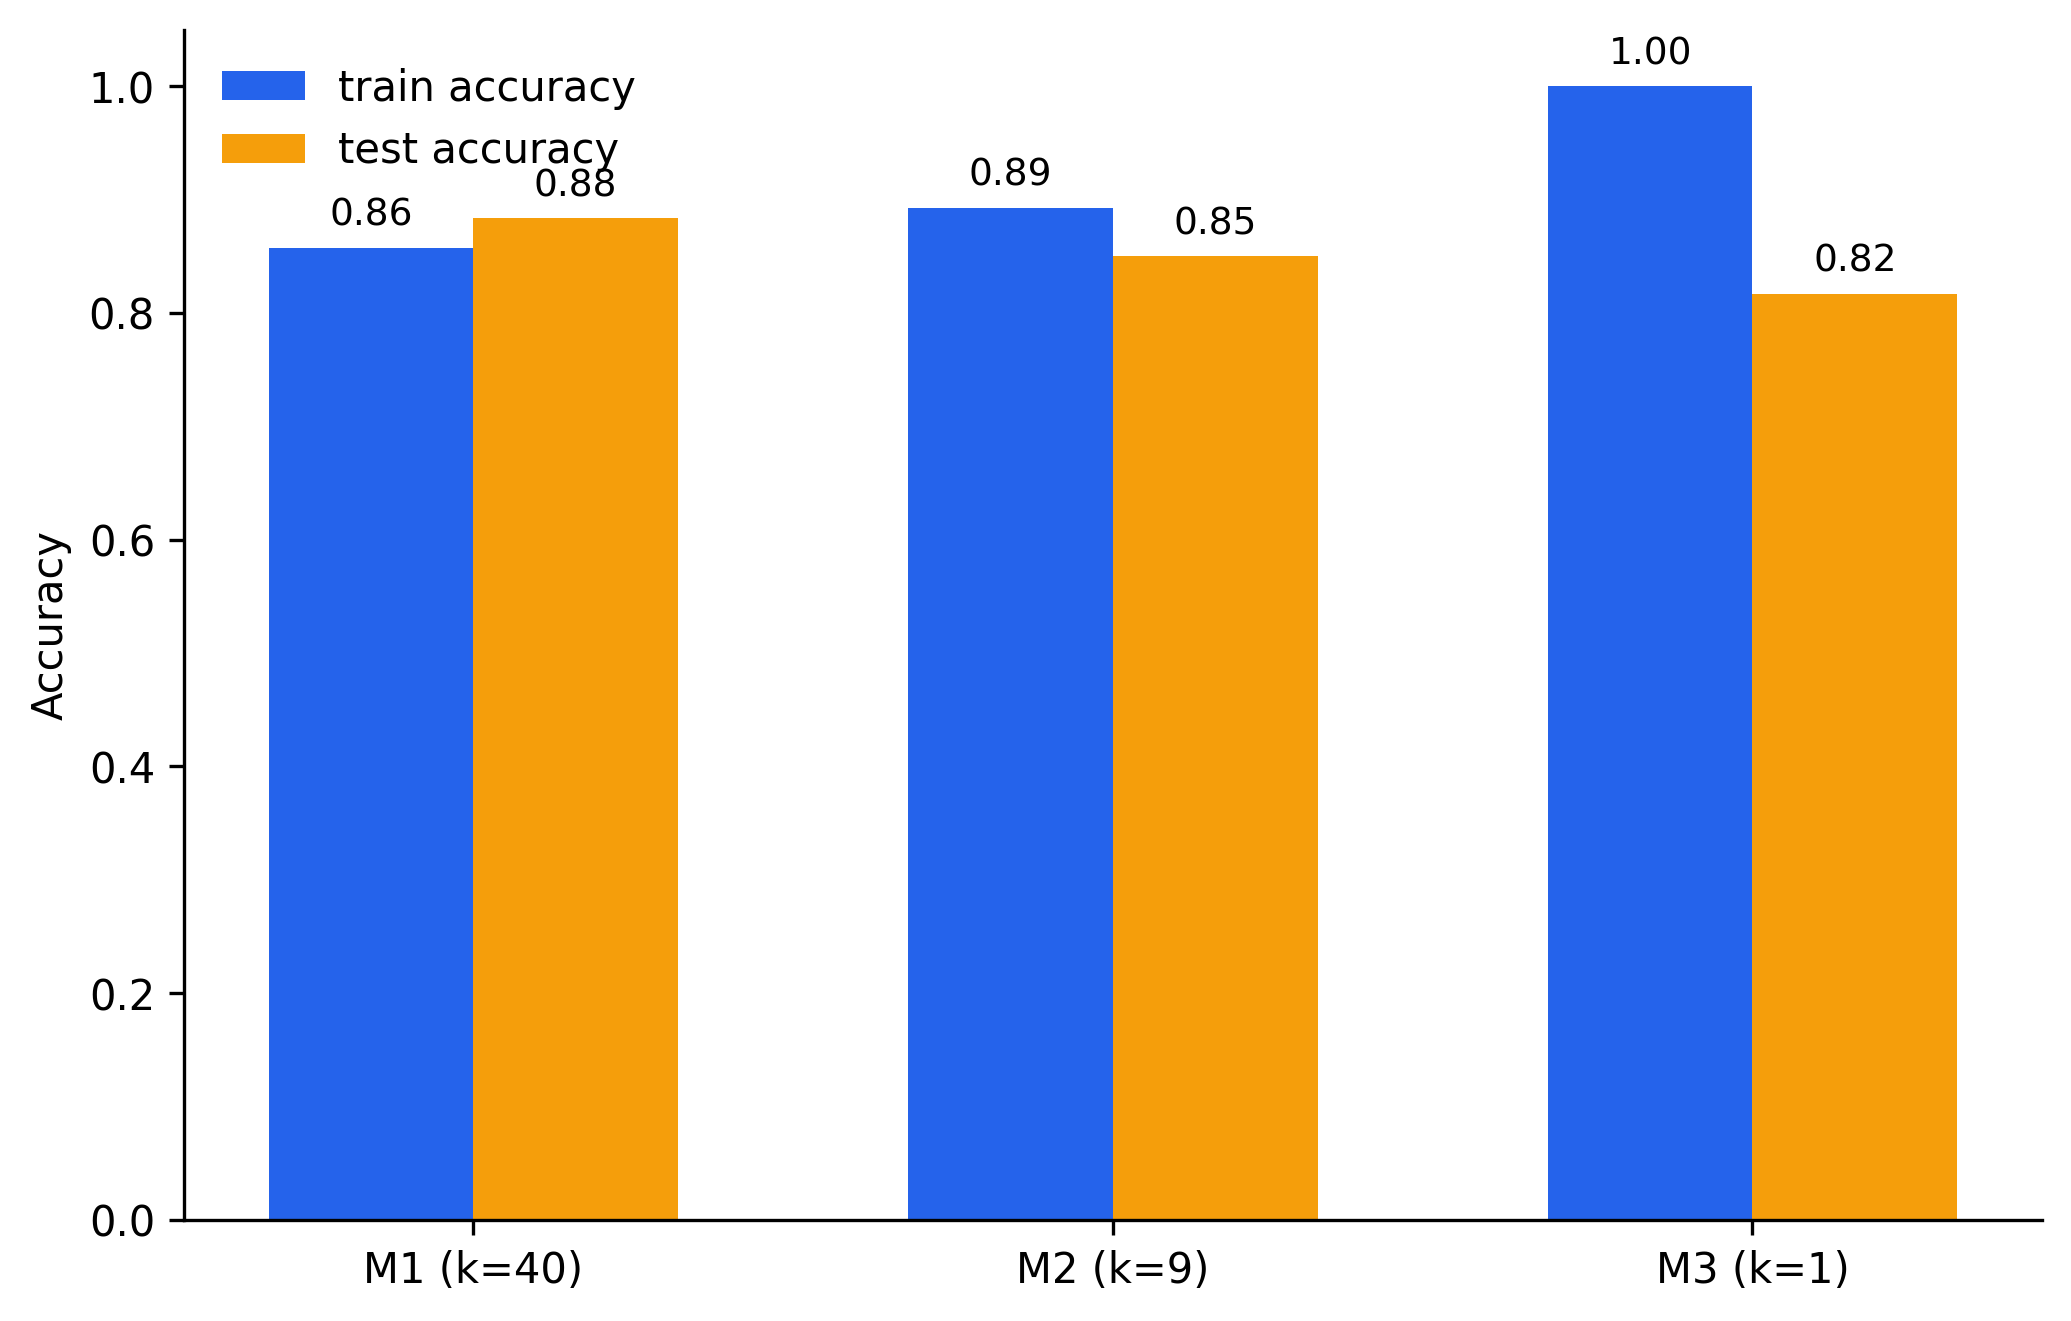
- (k=40): train accuracy 0.86, test accuracy 0.88. Both low, but close together.
- (k=9): train accuracy 0.89, test accuracy 0.85. Both reasonably high, close together.
- (k=1): train accuracy 1.00, test accuracy 0.82. A large gap: the model scores perfectly on data it memorized, but noticeably worse on data it hasn't seen.
That gap between train and test performance is variance. and have low variance, their accuracy barely shifts between train and test. has high variance, it memorized quirks specific to the training set that do not carry over to new data.
The Goal: Low Bias and Low Variance
Bias tells you how well a model fits the pattern it trained on. Variance tells you how much that performance holds up on new data. A useful model needs both:
- Low bias, so it is flexible enough to actually capture the true pattern.
- Low variance, so its performance doesn't collapse the moment it sees new data.
Of the three models, only achieves both. has low variance but pays for it with high bias. has low bias but pays for it with high variance. Neither extreme is what you want, you want a model sitting in the middle that is flexible enough to fit the pattern, but not so flexible that it starts fitting noise.
Connecting It to Underfitting and Overfitting
These two failure modes already have names you've likely heard before:
- Underfitting = high bias. is the underfitting case: too simple to capture the pattern, so it performs poorly on both train and test data.
- Overfitting = high variance. is the overfitting case: complex enough to memorize the training data exactly, but that memorization doesn't generalize, so test performance suffers.
- A good fit = low bias and low variance together. is neither underfitting nor overfitting: it captures the real pattern without memorizing noise.
This is the bias-variance tradeoff: pushing model complexity down reduces variance but raises bias, pushing it up reduces bias but raises variance. The goal of model selection is finding the sweet spot in between, like here.