
Ch.49: Why Random Forest Actually Works
Inspired by: YouTube
Ch.48 covered what random forest does mechanically. This one covers why that mechanism produces such a strong algorithm: it's a direct exploitation of the bias-variance tradeoff, and the reasoning holds up when you actually plot it.
The code below follows the random_forest_demo.ipynb notebook from the course's repo.
1. Recap: Bias, Variance, and the Tradeoff
A model's error decomposes into two pieces:
- Bias: error from the model being too simple to capture the real pattern, even on the data it was trained on. High bias looks like bad performance everywhere, training included.
- Variance: error from the model being so flexible it memorizes the training set's noise, not just its pattern. High variance looks like great training performance and unstable, unreliable predictions on new data.
Most algorithms sit at one end of an unavoidable tradeoff: push bias down (more flexibility) and variance goes up; push variance down (more constraints) and bias goes up. Fully-grown decision trees are the extreme low-bias, high-variance case: zero training error, but a small change in the data produces a very different tree. Linear and logistic regression sit at the other end: high bias, low variance, stable but rigid. What you actually want, low bias and low variance together, is not something a single model of either kind gives you.
2. Why Averaging Fixes This for Trees Specifically
Random forest gets both by starting from a pile of fully-grown trees (low bias, high variance by construction) and averaging away the variance without touching the bias. Here's the argument for why averaging does that, not just that it does.
Take a training set of 10,000 rows and imagine replacing 100 of them with noisy outliers. A single decision tree trained on the full set has to contend with all 100 of those bad points at once, its structure bends around every one of them, and its predictions shift accordingly: high variance in action. But hand that same 10,000-row set to a forest, where each tree only trains on a random subset (say 1,000 rows), and those 100 noisy points scatter across many different trees' subsets, a handful here, a dozen there, none at all in most. No single tree has to absorb the full damage. Averaging predictions across hundreds of trees that each saw a different, smaller dose of the noise dilutes the noise's effect on the final answer. That dilution is the variance reduction, it isn't a side effect, it's the direct consequence of decorrelating what each tree sees.
Bias barely moves under this process, because every individual tree is still a fully-grown, low-bias tree, capable of fitting whatever pattern is in its subset. The tradeoff isn't repealed, but its usual cost (bias goes up when variance goes down) doesn't apply here, because the fix operates through averaging correlated-but-not-identical models, not through constraining any one of them.
3. Seeing It on a Classification Boundary
make_circles generates a synthetic 2-class dataset with a clear circular decision boundary but a lot of overlap noise near it, exactly the kind of data where overfitting is easy to spot visually:
from sklearn.datasets import make_circles
from sklearn.model_selection import train_test_split

X, y = make_circles(n_samples=500, factor=0.1, noise=0.35, random_state=42)
X_train, X_test, y_train, y_test = train_test_split(X, y, test_size=0.2, random_state=42)
Fitting a single fully-grown DecisionTreeClassifier and a 500-tree RandomForestClassifier on the same split and plotting each one's decision region:
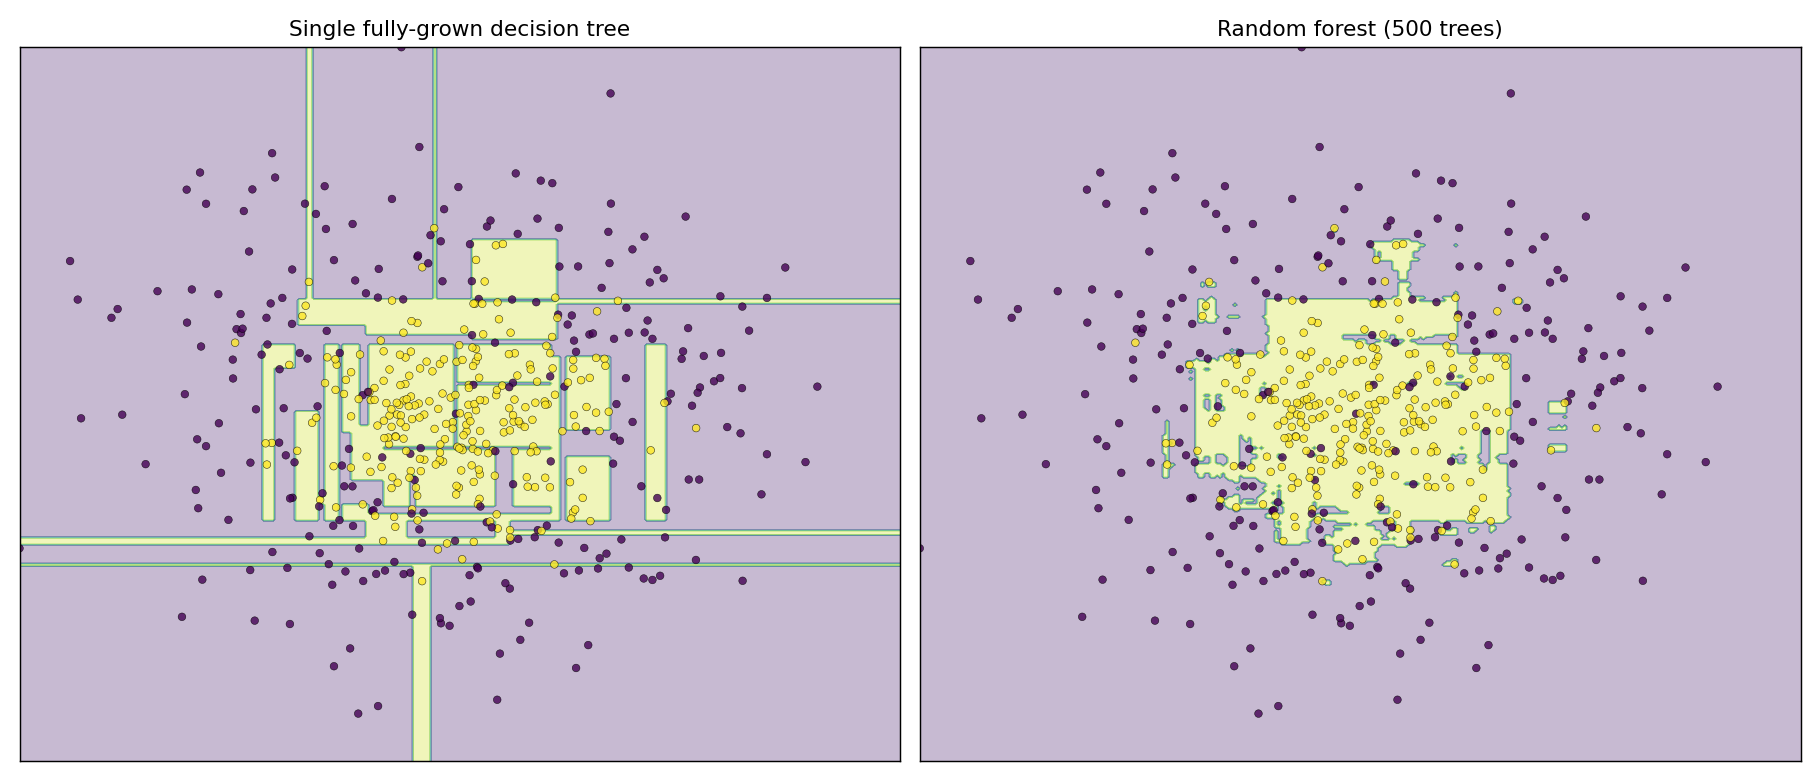
The single tree's boundary (left) is exactly what high variance looks like drawn out: thin rectangular tendrils reaching out toward individual isolated points, because the tree carved out a tiny region purely to classify one point correctly, memorizing noise rather than the underlying circular pattern. The forest's boundary (right) is close to the actual circular shape the data was generated from, with those isolated tendrils gone. In this run both models still reach 0% training error (100% training accuracy), so bias didn't visibly increase here, but held-out accuracy moves from 0.86 (single tree) to 0.89 (forest), the variance reduction showing up as a real generalization gain, not just a cleaner-looking picture.
4. Seeing It on a Regression Curve
Same argument, regression version. Generate noisy samples around a fixed two-bump curve:
import numpy as np
from sklearn.tree import DecisionTreeRegressor
from sklearn.ensemble import RandomForestRegressor

def f(x):
    x = x.ravel()
    return np.exp(-x ** 2) + 1.5 * np.exp(-(x - 2) ** 2)

def generate(n_samples, noise, seed):
    rng = np.random.RandomState(seed)
    X = np.sort(rng.rand(n_samples) * 10 - 5).reshape(-1, 1)
    y = f(X) + rng.normal(0.0, noise, n_samples)
    return X, y

X_train, y_train = generate(n_samples=150, noise=0.1, seed=1)
X_test, y_test = generate(n_samples=1000, noise=0.1, seed=2)

dtree = DecisionTreeRegressor(random_state=42).fit(X_train, y_train)
rf = RandomForestRegressor(n_estimators=1000, random_state=42).fit(X_train, y_train)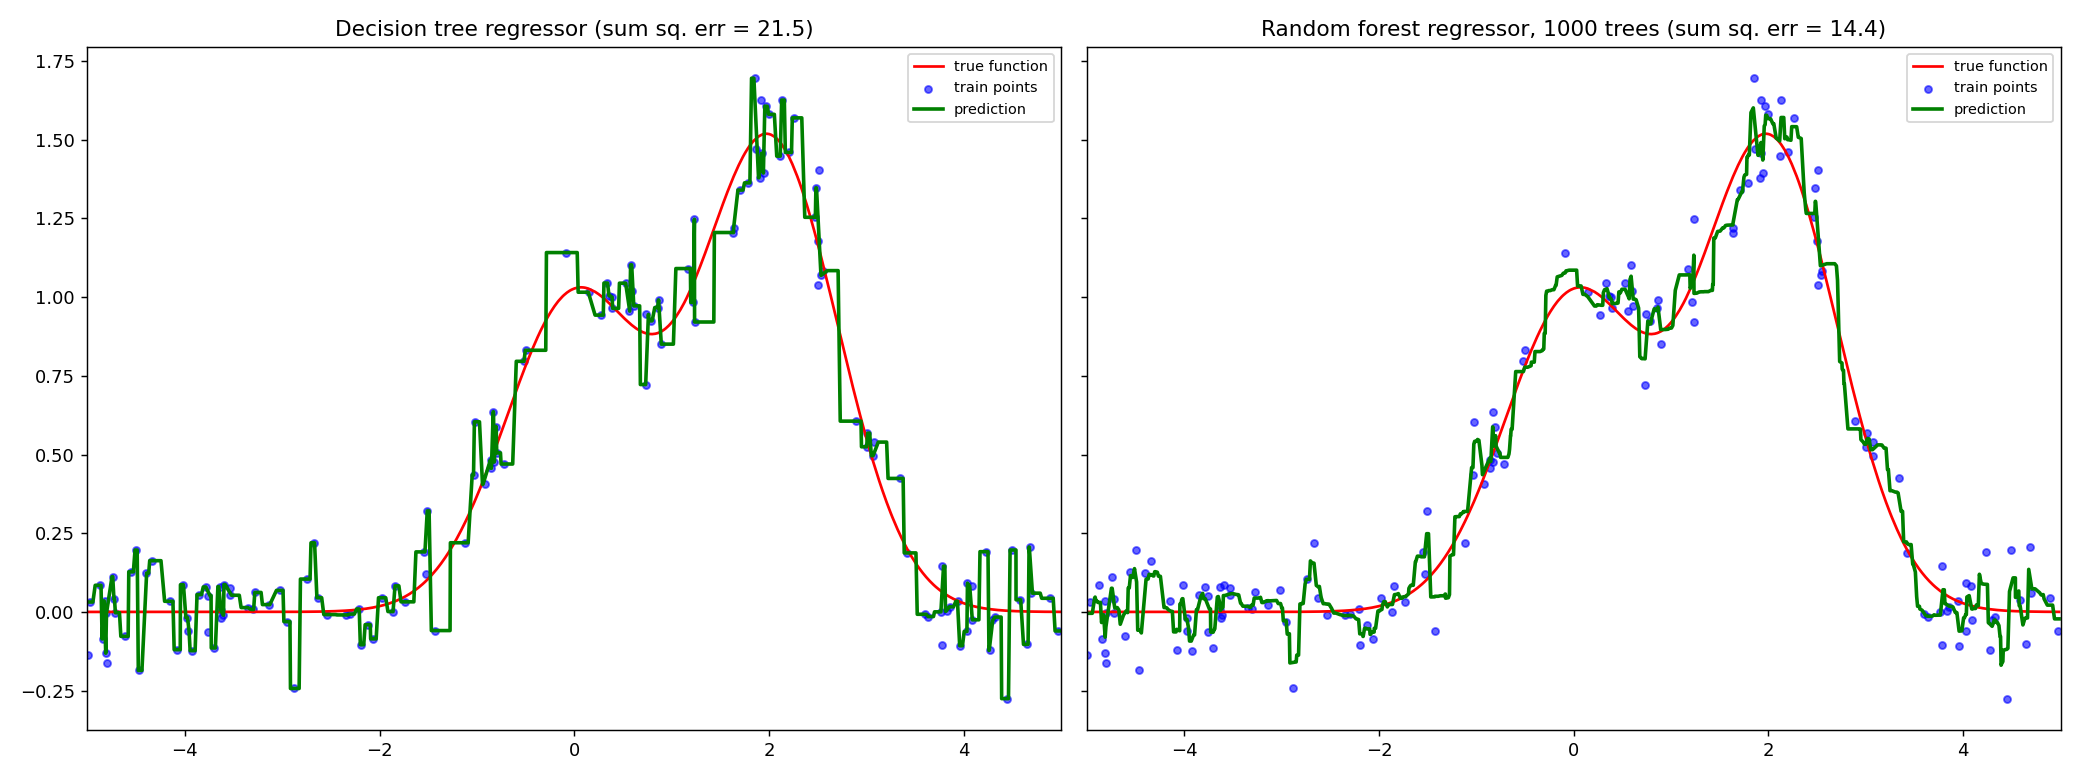
The single tree (left) chases every noisy point it was trained on, including the ones that are clearly noise, not signal, jagged spikes up and down that have nothing to do with the true curve. The forest (right) smooths almost all of that out and tracks the true curve closely. Quantified as summed squared error on 1,000 held-out points: 21.5 for the lone tree versus 14.4 for the forest, a meaningfully lower error from doing nothing except averaging many versions of the same overfitting model.
5. What to Take Away
- Fully-grown decision trees are the textbook low-bias, high-variance model: perfect training fit, unstable predictions.
- Random forest doesn't get around the bias-variance tradeoff, it exploits how variance behaves under averaging: training each tree on a different random subset spreads out the influence of any noisy or unusual point, so no one tree's overfitting to it survives the vote or the mean.
- This shows up as visibly cleaner decision boundaries and regression curves, and as a real, measurable improvement in held-out accuracy or error, not just a smoother-looking chart.
Next: bagging versus random forest specifically, the one mechanical difference between them flagged back in Ch.48, and what it buys you.